Tree & List Views
The structure tree
The left pane lists every structure PPEE found. Directories that the file doesn't have are left out, and counts appear in parentheses.
| Tree node | Contents | CLI | Feature page |
|---|---|---|---|
| File Information | Path, size, format, timestamps, CRC32, entropy, MD5/SHA-1/SHA-256, SSDEEP, TLSH, ImpHash, Authentihash | --hashes | Hashes |
| Analysis (only when a runtime is detected) | Derived views for .NET, Go, Rust and NativeAOT (see below) | --analysis | Runtime Analysis |
| DOS Header | IMAGE_DOS_HEADER | --headers | Headers |
| Rich Header | Decoded toolchain records | --richheader | Rich header |
| NT Header → File Header → Optional Header → Data Directories | IMAGE_NT_HEADERS | --headers, --dirs | Headers |
| Section Headers (n) | Section table | --sections | Sections |
| DIR_ENTRY_EXPORT (n) | Exports | --exports | Exports |
| DIR_ENTRY_IMPORT (n) | Modules → functions | --imports | Imports |
| DIR_ENTRY_RESOURCE (n) | Type → name → language | --resources | Resources |
| DIR_ENTRY_EXCEPTION (AMD64/ARM64, n) | RUNTIME_FUNCTIONs + unwind codes | --exception | Exceptions |
| DIR_ENTRY_SECURITY (n certificate(s)) | Authenticode | --security | Authenticode |
| DIR_ENTRY_BASERELOC | Blocks → entries, with a rebase preview | --basereloc | Relocations |
| DIR_ENTRY_DEBUG (n) | CodeView, POGO, FPO, … | --debug | Debug |
| DIR_ENTRY_TLS (n) | TLS + callbacks | --tls | TLS |
| DIR_ENTRY_LOAD_CONFIG | Header, Safe SEH, Guard tables, Volatile Metadata | --loadconfig | Load Config |
| DIR_ENTRY_BOUND_IMPORT (n) | Bound imports | --bound-imports | Imports |
| DIR_ENTRY_DELAY_IMPORT (n) | Delay-load imports | --delay-imports | Imports |
| DIR_ENTRY_COM_DESCRIPTOR | .NET header → MetaData (#~ tables, #Strings, #US, #GUID, #Blob) → VTableFixups | --net | .NET |
| AppManifest | Parsed manifest | --appmanifest | Manifest |
| Strings in file → ASCII / UNICODE / URL / Registry / Suspicious | String scan | --strings | Strings |
Clicking anywhere on a collapsed node's row expands it, not just the arrow. When a file is opened or refreshed, DOS Header is selected.
Warning and error markers
A small colored dot on a tree icon means at least one field under that node looks anomalous. The field itself is highlighted in the same color and its Comment column explains the problem. Orange marks warnings and red marks errors; both colors are configurable in Settings → General. Checks include:
| Where | What is flagged |
|---|---|
| Data Directories | Architecture (7) and the final Reserved (15) slot must be zero, and Global Pointer (8) must have size 0: a violation is an error. For Security and Bound Import, which store a file offset, an offset beyond the end of the file or a table that runs past the end of the file is an error, and a Security table that isn't 8-byte aligned is a warning |
| Section Headers | The first section starting inside the headers, a section out of ascending address order (warning) or overlapping another in memory (error) |
| Security | The embedded digest differs from the computed Authentihash (the file was modified after signing), and a certificate not yet valid or expired. Valid From/To show "N days ago / N days remaining" |
| Timestamps | A value in the future, except FFFFFFFF (the "no timestamp" marker) and reproducible-build hashes |
| Import / Delay import (Windows) | Modules not found in the System and Windows directories, or with invalid names |
| Other tables | Out-of-range RVAs, bad versions and sizes, and unexpected field values, such as in the load config DVRT |
See the data-directory pages for what each anomaly means for analysis, for example Security.
The Analysis node
Right after File Information, every file gets an Analysis node. It holds derived views that PPEE builds from the file, so they're marked as such: a diamond glyph and teal label in the tree, and a banner above the view naming what it was built from.
- Facts comes first: what the file's structure shows, as facts, the same as MCP's
triage_pe. Loose facts are listed by area, with the instructions behind code facts; facts that one explanation accounts for (an entry-section profile, a toolchain layout) are listed under it. Start here when you open a sample. - Then one node per runtime PPEE detects: .NET, Go, Rust, NativeAOT, PyInstaller, and Code for x86/x64.
Linux screenshot: Analysis node
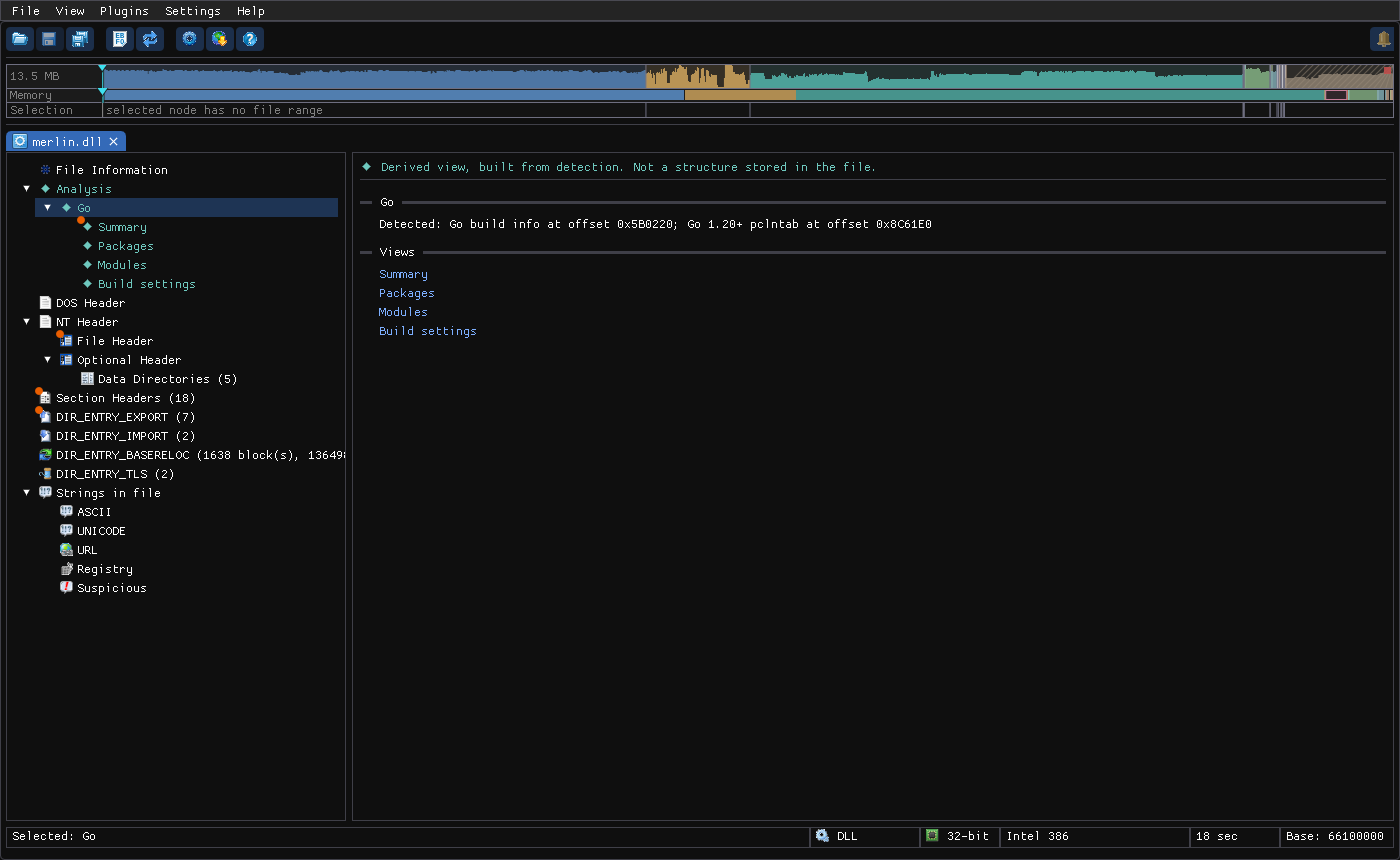
- Summary views are short reports. Values are links that select the tree node, jump to the table row (which is highlighted), or open the hex view on the source bytes.
- Table views (packages, modules, imports, …) behave like the other list views. Rows can offer Go to …, also on double-click, to reach the structure behind them.
- Some checks run only on request. The Summary shows Run the deep pass..., which asks for confirmation and then runs in the background with a progress bar.
See Runtime Analysis for what each analyzer reports.
Upper and lower list views
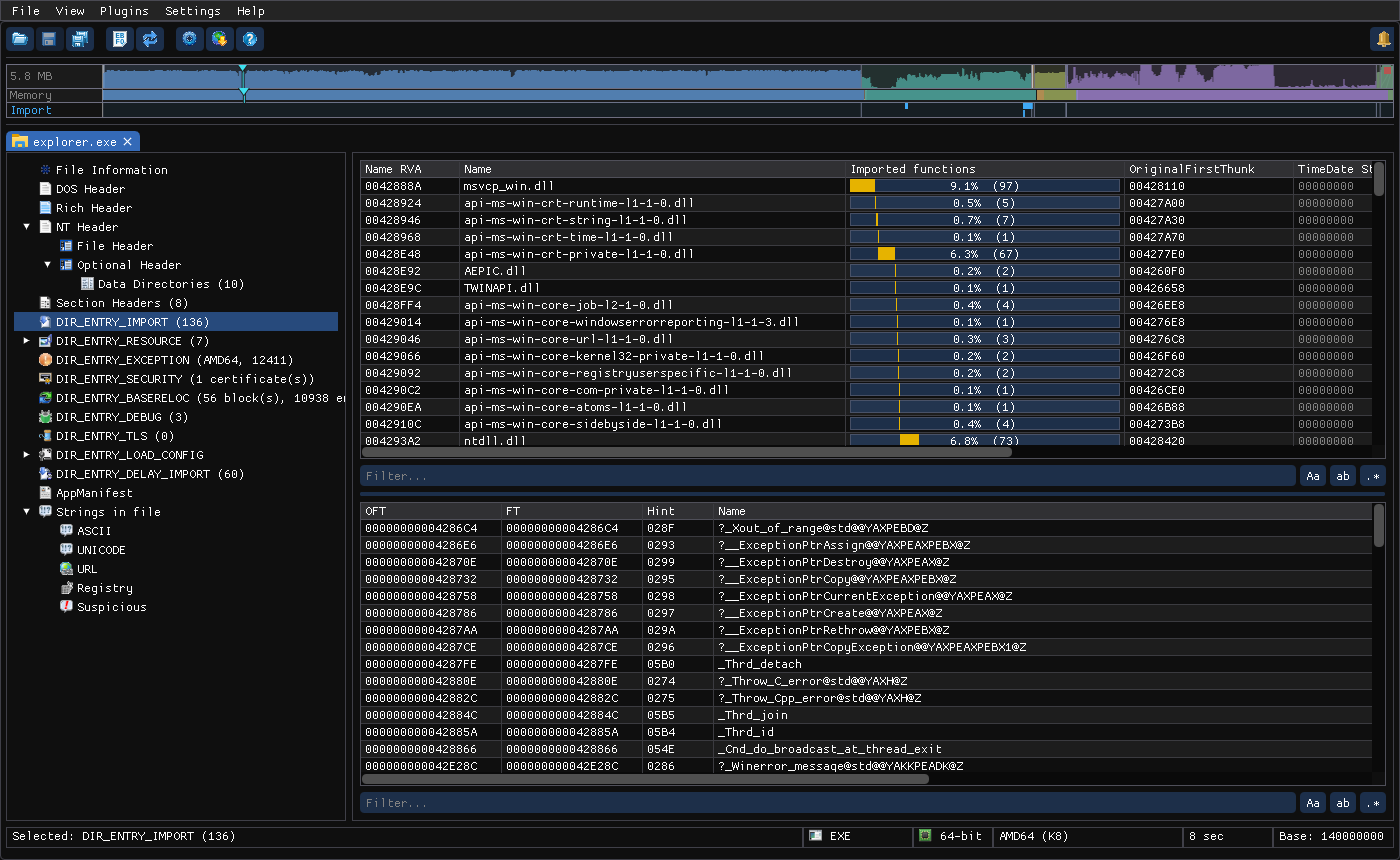
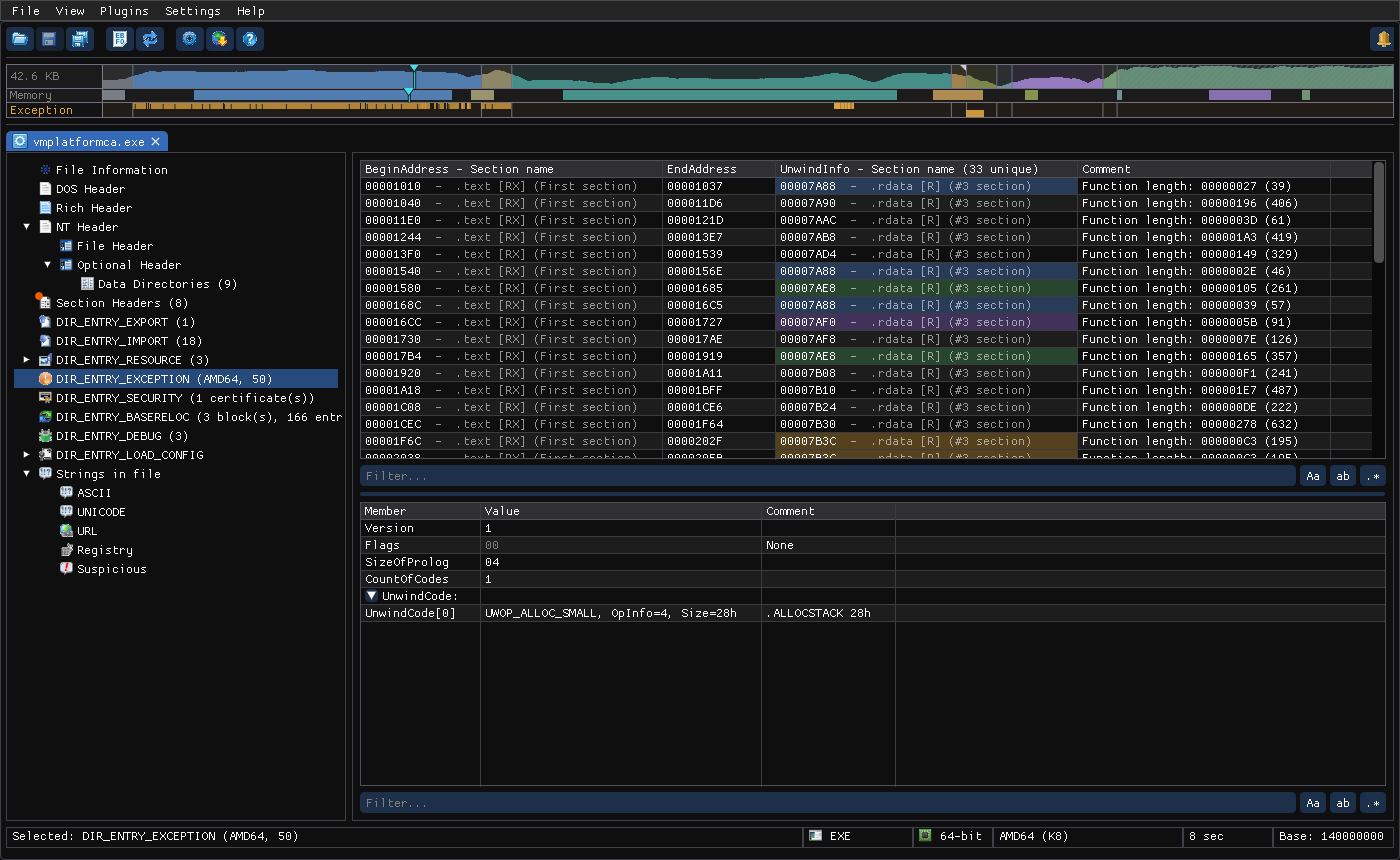
Selecting a tree node fills the upper list. For table-shaped nodes, selecting an upper row fills the lower list with that row's details:
Linux screenshot: Imports: modules above, functions below
Linux screenshot: Exception directory: RUNTIME_FUNCTIONs above, decoded unwind codes below
Things to notice:
- Bar columns such as Imported functions and Size ratio show each row's share of the total.
- Cross-references are resolved inline: RVAs show their section (
.rdata [R] (#3 section)), and .NET tokens show their target (Field[0x0001]). - Rows sharing a value are tinted with the same color. In the exception view, entries that share one unwind block have the same color.
- Columns can be resized and sorted (click a header; a third click restores file order).
Filtering
Each list has a Filter… box. Type to narrow the rows, then refine with the toggles:
| Toggle | Meaning |
|---|---|
| Aa | Case-sensitive |
| ab | Whole word |
| .* | Regular expression (for example ^Nt.*File$ over import names) |
A row is kept when any one of its cells matches. Esc clears the box.
Regular expressions
With .* on, the text is an ECMAScript regular expression (the JavaScript dialect). How it matches:
- One cell at a time. A pattern can't span two columns, and
^and$mark the start and end of a single cell. - Anywhere in the cell.
AllocmatchesVirtualAllocEx. Use^…$to match the whole cell. - Case-insensitive unless Aa is on.
- Whole word. With ab on, the pattern is wrapped in
\b(?:…)\b, soNt|Zwmatches the separate wordsNtandZwbut notNtOpenFile. - An invalid pattern turns the box red, and hovering it says Invalid regular expression. No rows are shown until you fix it.
- Keep patterns in plain ASCII. Accented or other non-ASCII letters typed in the box don't match.
- Not supported: lookbehind (
(?<=…)) and named groups.
Patterns that work well:
| Goal | Pattern | Where |
|---|---|---|
| Process injection APIs | VirtualAlloc(Ex)?|WriteProcessMemory|CreateRemoteThread|NtMapViewOfSection|QueueUserAPC | Imports |
| Native API by prefix | ^(Nt|Zw|Rtl) | Imports |
| Dynamic API resolution | ^(LoadLibrary|GetProcAddress|LdrGetProcedureAddress) | Imports |
| ANSI/Unicode pairs of one API | ^CreateFile[AW]$ | Imports |
| Anti-debugging | IsDebuggerPresent|CheckRemoteDebuggerPresent|NtQueryInformationProcess|OutputDebugString | Imports |
| Crypto and hashing | ^(Crypt|BCrypt|NCrypt) | Imports |
| URLs | https?:// | Strings |
| IPv4 addresses | \b\d{1,3}(\.\d{1,3}){3}\b | Strings |
| Run keys and persistence | CurrentVersion\\(Run|RunOnce)|schtasks|\\Startup\\ | Strings |
| Files by extension | \.(exe|dll|sys|ps1|bat|vbs)\b | Strings |
| Recovery tampering | vssadmin|bcdedit|wbadmin|shadowcopy | Strings |
| Base64-looking blobs | ^[A-Za-z0-9+/]{40,}={0,2}$ | Strings |
| PDB and user paths | \.pdb$|[A-Z]:\\Users\\ | Strings, Debug |
| Addresses in a writable or executable section | \[R?WX?\]|\[R?W?X\] | Any list with RVAs (cells such as .text [RX] (#1 section)) |
In regular expressions \, ., (, ), [, |, ?, *, + and $ have special meanings. To match one of them as an ordinary character, put a \ before it: \.dll matches the text .dll.
Row context menu
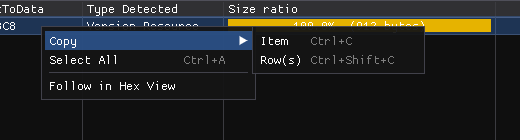
Linux screenshot: Row context menu with Copy submenu
| Item | Shortcut | Action |
|---|---|---|
| Copy → Item | Ctrl+C | Copy the clicked cell |
| Copy → Row(s) | Ctrl+Shift+C | Copy the selected rows, tab-separated |
| Select All | Ctrl+A | Select every row |
| Follow in Hex View | Ctrl+H | Open the hex view at the bytes behind this cell or row, centered and selected |
| Show Code | Ctrl+D | (Cells holding a code address) Open the Code window there |
| Show Call Sites (n) / Show References (n) | - | (Import functions / strings) The code that calls or uses this item |
| Dump… | - | (Section and resource language rows) Save the raw bytes to a file |
| Open in New Tab | - | (Same rows) Open those bytes as a document of their own, in memory: an embedded PE or a dropped payload is browsed like any file, without writing it to disk. Layers nest. Save As… writes it out if you need the file |
Corner marks
A small triangle in a cell's top-left corner means the value links to code: an address in executable bytes, a non-zero Call sites or Referenced by count, or a Code analysis row. Click it to open the Code window.
Related: Hex View · Code Window · Editing · PE Features
References
- Regular expressions guide (MDN): the ECMAScript pattern syntax used by the filter box, with examples.
- Modified ECMAScript regular expression grammar (cppreference): the exact dialect the filter box uses.
- regex101: test a pattern before using it; pick the ECMAScript (JavaScript) flavor.