Navigator Strip
The navigator strip sits under the toolbar. It draws a full-width map of the active file in raw file offsets, so overlays, gaps and packed sections are visible at a glance.
Linux screenshot: Navigator strip with a section tooltip

Annotated example
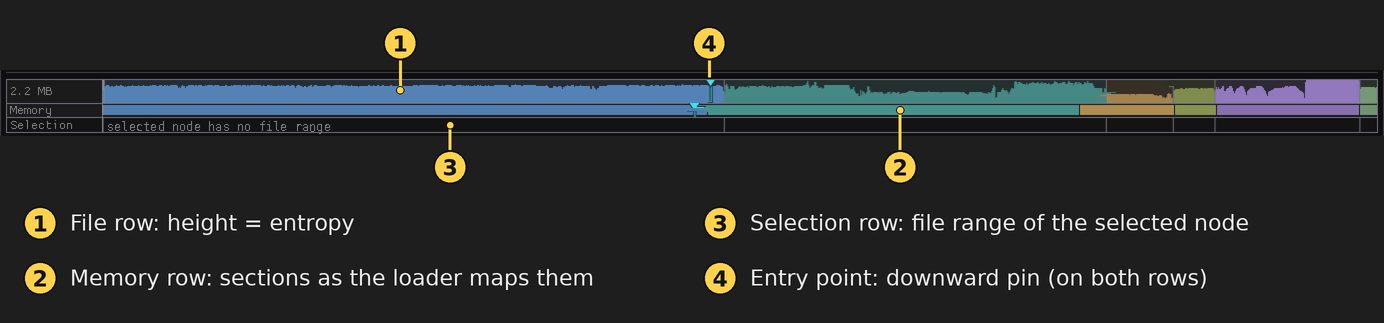
The numbers match the rows and indicators described below, on a Windows capture of a NativeAOT ransomware sample.
Windows screenshot: navigator strip with rows and indicators labelled
A UPX-packed file
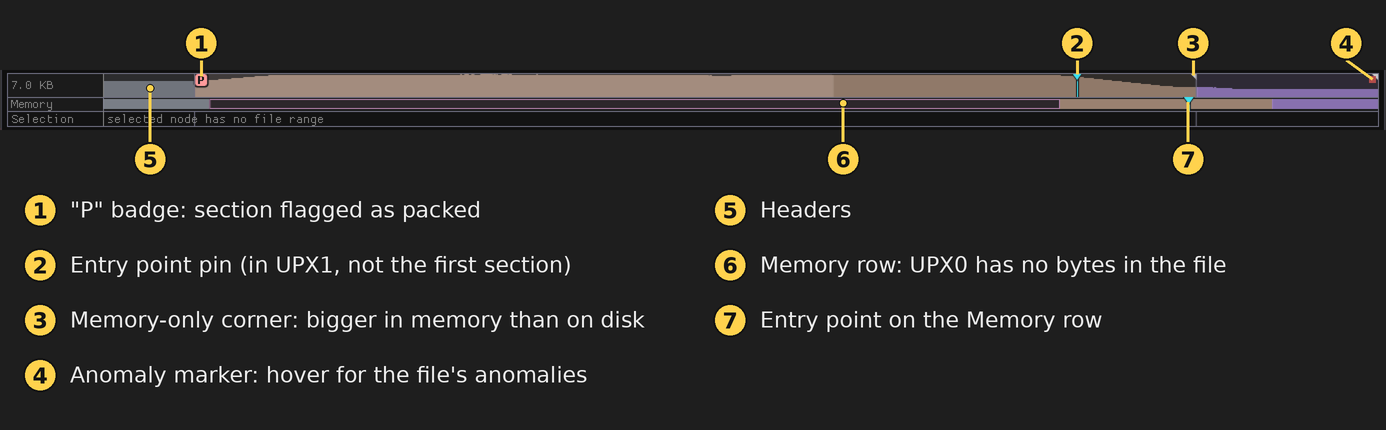
The headers are followed by UPX0, which has no bytes in the file: it shows up only on the Memory row, as an outlined block. The entry point is in UPX1.
Windows screenshot: a UPX-packed sample, with packing, entry point, memory-only and anomaly markers labelled
An embedded payload and a directory lane
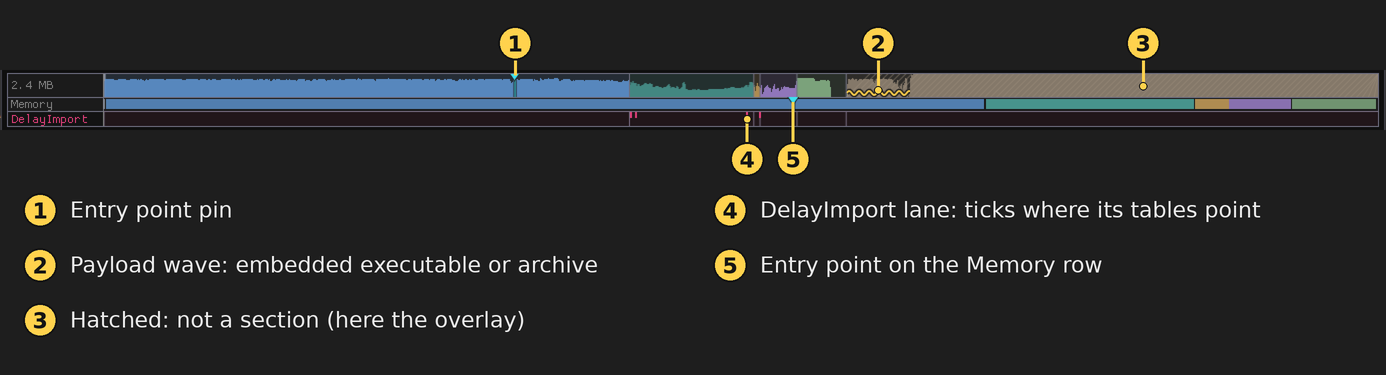
Selecting Delay Import in the tree adds its lane under the band. The yellow wave marks an embedded executable or archive that PPEE found inside the file; hover it to see what it is.
Windows screenshot: a payload wave, the hatched overlay and the DelayImport lane labelled
A signed file with appended data
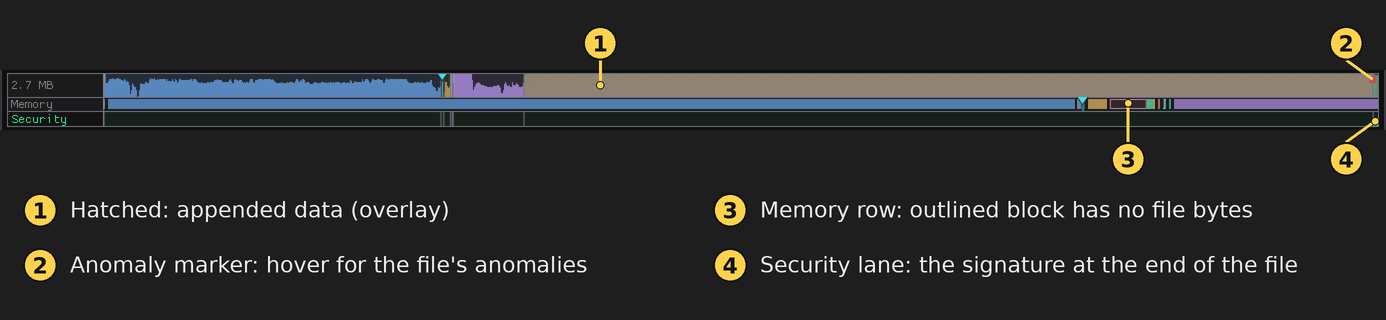
Selecting Security shows where the certificate table sits: at the very end, after the appended data.
Windows screenshot: overlay, Security lane, anomaly marker and a memory-only block labelled
The two band modes
The File and Memory rows (the band) can be colored in one of two ways. Choose it from the right-click menu:
| Mode | What the height and color mean | Use it to |
|---|---|---|
| Band: entropy (default) | Height is the average entropy of that stretch of bytes, from 0 (one repeated value) to 8 (random-looking). Color is a shade for the same value | Spot compressed, encrypted or packed data at a glance: a flat, tall top near 8 is data that has been transformed |
| Band: byte classes | Height is fixed; color is the kind of byte. The classes, in order, are zero (00, dim gray), text (printable ASCII, mid gray), control (other low bytes, green), high (bytes 80-FE, blue) and 0xFF (red) | See the shape of the content: long gray runs are text, blue and red are binary structures or encrypted bytes, green is code-like or table data |
The two modes read the same bytes, so switch between them when one is unclear. Entropy tells you how random a region is; byte classes tell you what kind of bytes it holds. A region with entropy 6.5 may be a mix of text and binary tables, and byte classes tell them apart.
Rows
| Row | Shows |
|---|---|
| File (labelled with the file size) | Each header, section, gap and overlay as a colored region. The height of the skyline is the entropy of that stretch, so compressed or encrypted data shows up as a flat top near 8 |
| Memory | The same regions laid out as the loader maps them (RVA order and virtual sizes) |
| Selection | The file range of the currently selected tree node, labelled with its name (for example Import, Security) |
| Code | (x86/x64, after the background code scan) The file ranges decoded as instructions, with TLS callbacks as ticks. Gaps are data, or code reached only through computed jumps. A packed file shows only a sliver at the unpacking stub |
Indicators
Each indicator has its own shape, not only its color, so it stays readable for color-blind viewers and in both themes.
| Indicator | Shape and color | What it tells you | What to do next |
|---|---|---|---|
| Entry point | Downward pin, on a stem through the band. Cyan in dark mode, navy in light mode | The address where execution starts (AddressOfEntryPoint) | Check which section it lands in. An entry point in a section that is not .text is a common sign of a packer stub |
| Packing "P" badge | Letter P in a small square at a section's top-left corner. Red in dark mode, purple in light mode | PPEE thinks the section is packed: writable and executable, very high entropy, or similar. The tooltip gives the reason | Open the section and read its entropy and characteristics. Then check the Code window for an unpacking stub |
| Payload wave | A wave (~) along the bottom edge of the band. Yellow (with a dark outline in light mode) | Embedded data worth a look, such as an overlay or a resource blob that is not part of the normal layout | Select it in the tree, then use Hex View or Hashes & entropy on that range |
| Caret | Muted gray marker | Where the hex view caret is now, so you can follow it along the file | Nothing. It is for orientation |
| Anomaly marks | A small red square at the strip's right edge; hover it for the list. Per-region anomalies are in that region's tooltip | Things like a section that overlaps .text or extends past end of file | Treat them as structural evidence. They are often hand-made or damaged headers |
| Memory-only corner | A small corner marker on a section | Bytes that exist only in memory (VirtualSize larger than SizeOfRawData). They have no file offset and take no width on the strip | Check the Memory row to see how far the loader expands the section |
Hover a marker or region to see its tooltip.
Tooltips
Hover any region to see:
- its index, name and file range
- entropy (0–8)
- VirtualSize and SizeOfRawData, plus characteristics (for example RX code)
- packing indicators such as writable and executable or executable, entropy 7.61 (the reason behind a "P" badge)
- anomalies such as overlaps .text or extends past end of file
Bytes that exist only in memory (VirtualSize > SizeOfRawData) appear as a corner marker on the section. They have no file offset, so they don't take up width on the strip.
Right-click menu
| Item | Effect |
|---|---|
| Hide overlay (n MB) | Leave appended overlay data (installers, signatures) out of the scale, so the image itself gets the full width |
| Band: entropy | Height and color show entropy (the default) |
| Band: byte classes (as in the hex view) | Color by byte class: zero, printable, high and so on |
| All directory lanes | Add one lane per data directory. Solid bars are where the directory's own data lives, and ticks are what it points at (thunks, callbacks, resource blobs). Hover a lane to see its connectors |
The chevron at the strip's edge expands and collapses the lanes. View → Navigator strip hides the whole strip.
Related: Hashes & entropy · Hex View · Code Window