Code Window
The Code window is a read-only disassembly view, one per tab, like the hex view. It shows x86/x64 instructions in plain Intel syntax with names instead of raw addresses where PPEE knows them (imports, exports, entry point, TLS callbacks, the Control Flow Guard pointers) and the referenced string as a comment.
| Column | Contents |
|---|---|
| Address | The instruction's VA |
| Bytes | Its encoding (toggle with the Bytes checkbox, or in Settings) |
| Instruction | Calls, jumps and stops are colored like the hex view's byte classes |
| Comment | The referenced string, a hint such as reads the PEB, or what CFG says about the address (CFG call target) |
Windows screenshot: The Code window at a TLS callback: toolbar with back/forward, Go to, Earlier and Bytes, then Address, Bytes, Instruction and Comment columns
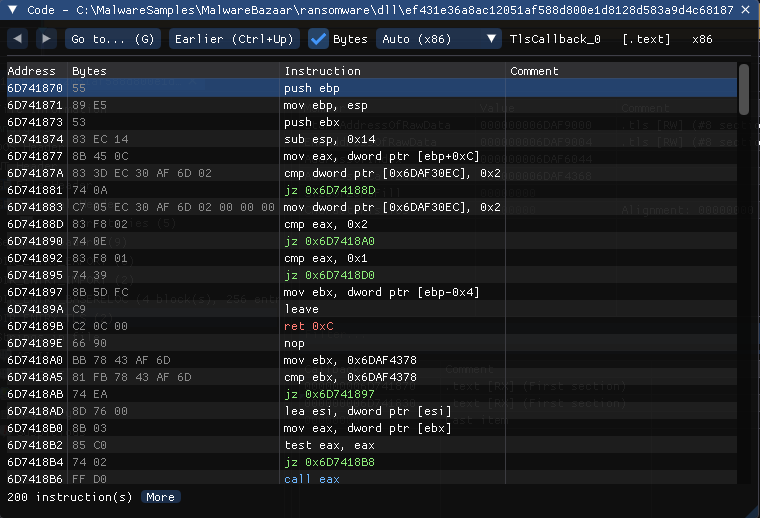
The toolbar has back/forward, Go to… (G), Earlier (Ctrl+Up) to decode backwards, the Bytes checkbox and the decoding mode. On the right, it names where you are: TlsCallback_0 [.text] x86, opened here from a TLS callback of a ransomware DLL. Conditional jumps are green, calls blue and returns red.
Opening it
| From | How |
|---|---|
Any table cell or field value holding a code address (entry point, TLS callbacks, exports, .pdata functions, Load Config handlers, …) | Click the corner mark, or right-click → Show Code (Ctrl+D) |
| The hex view | Right-click → Show as Code (Ctrl+D) at the selection or caret. Bytes outside every section (an overlay) are decoded raw, which is handy for appended shellcode |
| Code analysis rows and evidence lines | Corner mark, double-click, or right-click → Show Code at 0x… |
| Go and NativeAOT function tables | Each function row links to its code |
| Import tables' Call sites and strings' Referenced by columns | Click the count, or right-click → Show Call Sites (n) / Show References (n) |
The corner mark
A small triangle in a cell's top-left corner, in the link color, marks a value that lands in executable code of the file, like a spreadsheet's comment marker. Hover it for a tooltip; click it to open the Code window there.
Moving around
| Keys | Action |
|---|---|
| Double-click, Enter | Follow the selected call or jump |
| Esc, Alt+Left | Back |
| Alt+Right | Forward |
| G | Go to an address (a VA, or an RVA below SizeOfImage, in hex) |
| X | References: the call sites of the import this instruction calls through, otherwise who calls or jumps here |
| Up / Down | Select the previous / next instruction |
| Ctrl+C | Copy the line |
| More button | Decode further |
Right-click an instruction for Follow, References, Calls from This Function, Uses of 0x…, Show in Hex View, Copy Line, Copy Address and Copy Listing.
- Calls from This Function lists every call out of the function holding the instruction, named (the function or the import): an outline of what it does.
- Uses of 0x421 (on an instruction with an immediate of
0x100or more) lists every instruction using that constant: the code behind a dialog control ID, a magic value, a hash. - References to code also show where its address is stored as a pointer in data. When there is no direct caller, that is how the code is reached; click one to see its bytes in the hex view.
- Go functions, and functions in the COFF symbol table of GNU-built files, show by name (
main.main). When the hex view is open, selecting an instruction highlights its bytes there.
Call sites and references
After a file loads, PPEE scans its code in the background (see Settings → Disassembly). When the scan lands:
- Import and Delay Import function tables get a Call sites column: how many instructions call or read that IAT slot (calls through
jmp [IAT]thunks included). It shows...while the scan runs. - Every Strings view (ASCII, UNICODE, URL, Registry, Suspicious) gets a Referenced by column.
- A non-zero count gets the corner mark. Clicking it opens the Code window with a references panel above the listing: function+offset, address and instruction of each site. Click a site to see it with a few instructions of lead-in.
Windows screenshot: The references panel above the listing: the one instruction that loads a C2 URL, with the URL as the comment
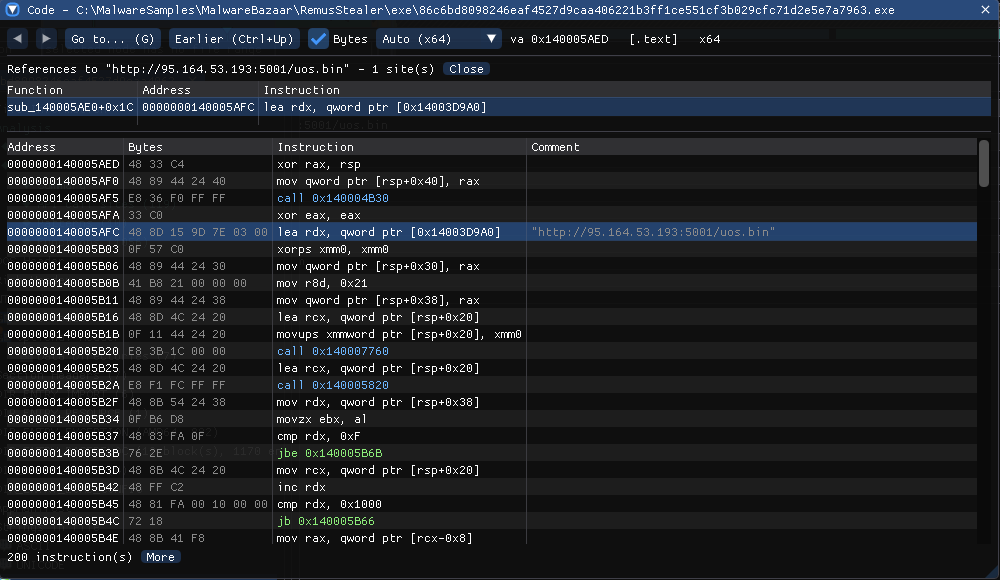
From Strings → URL of a shellcode loader (86c6bd80….exe), the Referenced by mark of http://95.164.53.193:5001/uos.bin opens this view. The panel lists 1 site, sub_140005AE0+0x1C, and the listing below shows it: lea rdx, [0x14003D9A0] with the URL as the comment. That function is where to start reading how the payload is fetched.
Example: triage a stealer in four clicks
At a glance
- Sample
STEALERDLL.dll- Question
- Is this a credential stealer, and for which browsers?
- You'll use
- Call sites and Referenced by columns · the references panel · Code Summary
Open STEALERDLL.dll.
- Import → CRYPT32.dll:
CryptUnprotectDatashows 3 call sites. Click the mark: the references panel lists the three DPAPI calls. - Strings → ASCII, filter
PK11:PK11SDR_Decrypt,PK11_Authenticate… each have Referenced by 3. The code uses them; they are not leftover library text. - Click a reference: the listing shows
lea rdx, [0x180118310] ; "PK11SDR_Decrypt"right aftercall [kernel32.GetProcAddress]. The DLL resolves Firefox's password-decryption function at run time. - Analysis → Code → Summary confirms it: Stored credentials: CryptUnprotectData (3), Modules loaded by name: nss3.dll.
Verdict in a minute: a browser-credential stealer targeting Chromium (DPAPI) and Firefox (NSS).
The Code lane
The navigator strip gets a Code lane after the directory lanes when the scan finishes: the file ranges decoded as instructions, with TLS callbacks as ticks. Gaps are data, or code reached only through computed jumps. On a packed file (for example the UPX sample 77549422….exe) the lane is a single sliver at the stub: the rest of the code is still compressed.
Limits
- x86 and x64 only (ARM64 files show no Code window).
- Static decoding: code that is unpacked, decrypted or generated at run time is not visible.
- Coverage follows direct calls and jumps; code reached only through computed jumps is missed. Use G or the hex view's Show as Code to decode any address by hand.
Related: Code analysis · CLI --disasm / --xrefs · Hex View
References
- Intel 64 and IA-32 Architectures Software Developer's Manuals: the instruction set reference behind the disassembly.
- x64 calling convention (Microsoft): how arguments are passed in registers on x64 Windows, useful when reading call sites.