.NET NativeAOT
NativeAOT compiles C# ahead of time to a native binary. There is no CLR header and no IL, so a .NET decompiler has nothing to open and the COM descriptor directory is empty. Attackers use it to get C# development speed with native-code opsec.
How PPEE detects NativeAOT
PPEE looks for a .managed section and the NativeAOT runtime's markers, and then for the module header (ReadyToRun-style header) that indexes the compiled code. The Detected line says which evidence it found, and whether the module header was located, for example a .managed section and the NativeAOT runtime's markers (no module header).
Views
| View | Shown when | Contents |
|---|---|---|
| Summary | always | Runtime, application (exports), code, layout clues |
| Assemblies | the module header is found | Assemblies and their metadata |
| Methods | the module header is found | Methods recovered from the reflection metadata and the stack-trace map |
Method rows link to their code: right-click → Show Code (or the corner mark) opens the Code window there.
What the Summary tells you
| Section | Facts |
|---|---|
| Runtime | Whether a module header exists and which runtime generation it implies. The runtime build is guessed from version strings (labelled (guessed)) |
| Application | The exports (NativeAOT DLLs expose functions with [UnmanagedCallersOnly]) |
| Code | How much metadata and method naming could be recovered |
| Layout clues | Overlay, sections with no file data, writable + executable sections |
Walkthrough: an obfuscated NativeAOT DLL
$ ppee-cli --analysis g4tj2aybt7y2xoq92p5e4y.dll
NativeAOT
  Detected: a .managed section and the NativeAOT runtime's markers (no module header)
Runtime
  Runtime: no module header: .NET 7 or earlier, or the header was removed
  Runtime build (guessed): 7.0.20+0fb6ac59f [offset 0x17008B]
Application
  Exports: 0Hd7vVgfx9 [export row 0]
  : 1RpQ9jnj [export row 1]
  : CLRCreateInstance [export row 19]  …
Code
  Without a module header the metadata and method names can't be located.
Layout clues
  - Overlay (appended data): 6144.0 KB [offset 0x3A9600]
CLRCreateInstance, CloseCtrs and CoEEShutDownCOM (decoys or a generated export table), and a 6 MB overlay, likely the payload. With a module header: a ransomware names itself
When the module header is still there, PPEE recovers the assemblies and the method names, and a NativeAOT binary tells you much more than its native code alone.
Windows screenshot: NativeAOT Summary of a ransomware: .NET 10 module header 16.0, entry assembly NoMatter, 15 assemblies and 4259 named methods
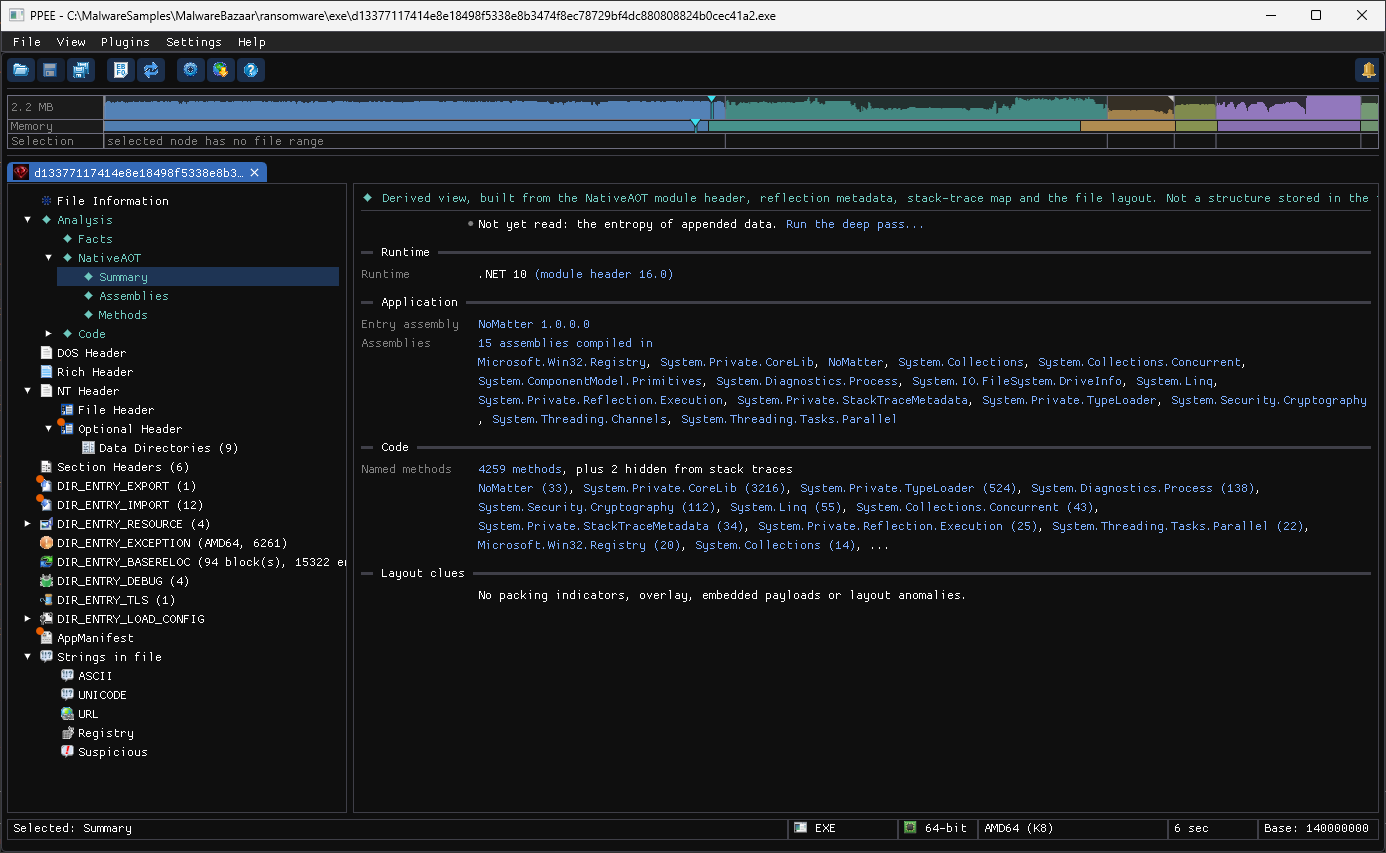
d1337711….exe (2.2 MB, x64): runtime .NET 10 (module header 16.0), entry assembly NoMatter 1.0.0.0, 15 assemblies and 4,259 named methods. The assembly list is a capability list already: System.Security.Cryptography, System.IO.FileSystem.DriveInfo (walk every drive), System.Diagnostics.Process (run commands), Microsoft.Win32.Registry.
Windows screenshot: NativeAOT Methods view: the NoMatter.Program methods DeleteShadowCopiesAsync, CollectFilesOptimized, EncryptSmallFileGCM, EncryptLargeFileCBC
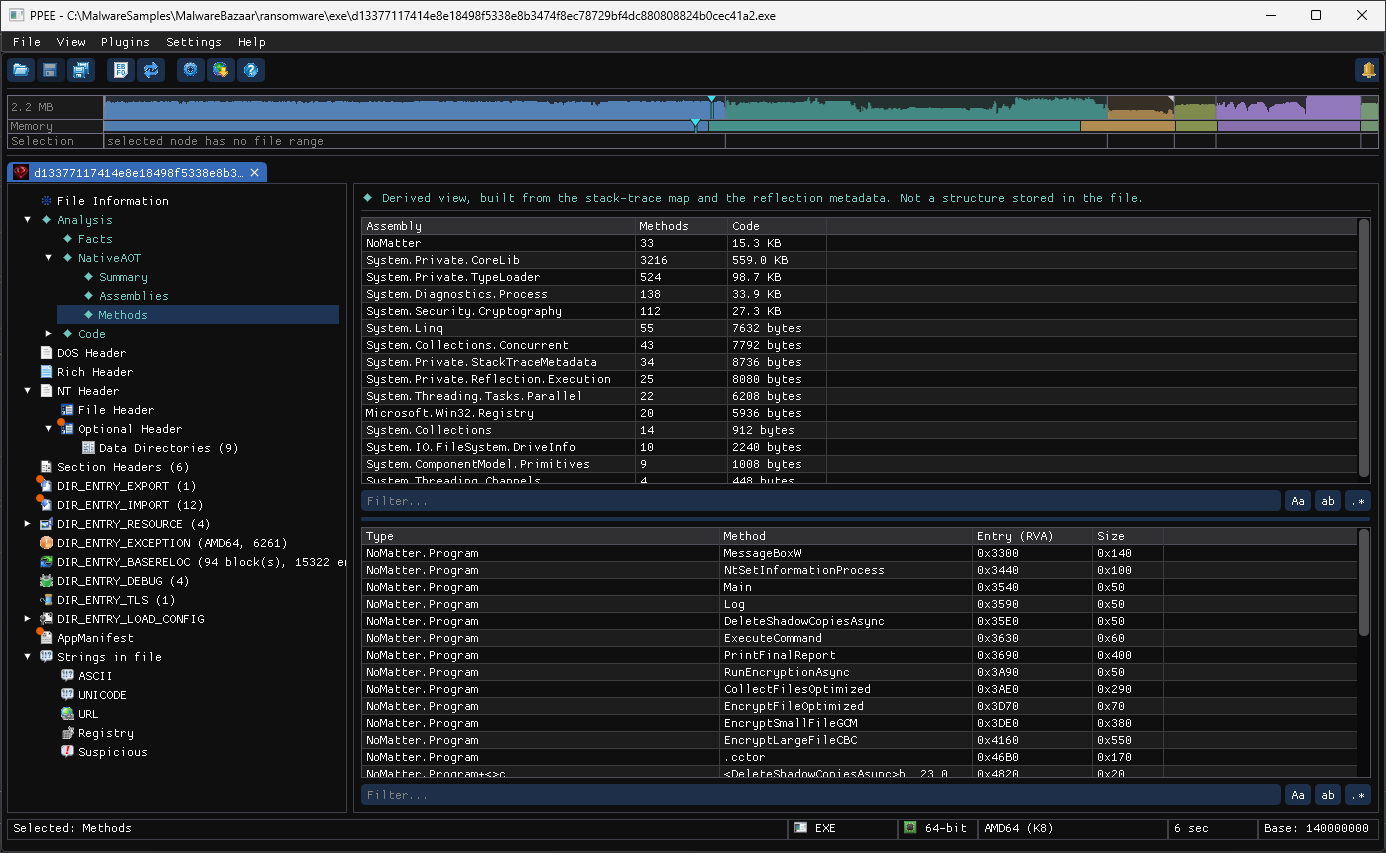
Methods, with the program's own assembly first: DeleteShadowCopiesAsync, RunEncryptionAsync, CollectFilesOptimized, EncryptSmallFileGCM, EncryptLargeFileCBC (AES-GCM for small files, CBC for large ones) and NtSetInformationProcess. That is ransomware, named by its author. Right-click a row → Show Code to read the method in the Code window. The same file's manifest asks for requireAdministrator.
Reading a NativeAOT binary like an analyst
| Observation | What it suggests |
|---|---|
.managed section, no CLR header, a normal .text | NativeAOT, not native C++. Don't expect IL |
| No module header on a recent runtime | The header was removed on purpose (or the runtime is .NET 7 or earlier, which lacks it): metadata and method names can't be recovered, so rely on strings and behavior |
| Randomly named exports in bulk | A generated export table (decoys), or a builder that renames exports per sample. Compare the export count and any real names across samples |
| Large overlay | Embedded payload or configuration. Run the deep pass to see its entropy |
Known .NET API names among exports (CLRCreateInstance) | Deliberate lookalikes of well-known CLR hosting functions |
| Runtime build string | Ties samples to the same SDK/runtime version: a clustering key |
CLI and JSON
ppee-cli --analysis f.dll
ppee-cli --json --analysis-deep f.dll | jq '.analysis.runtimes[] | select(.key == "aot")'

# How many exports, and the first few (a huge, random-looking table is itself a finding)
ppee-cli --json --exports f.dll | jq '{count: .exports.numberOfFunctions, sample: [.exports.functions[:5][] | .name]}'
Related: Analysis overview · .NET analysis · Export directory · --analysis
References
- Native AOT deployment (Microsoft .NET): how .NET apps are compiled ahead of time into native code.