.NET Assemblies
A .NET assembly is mostly metadata: type and method names, references, resources and attributes. PPEE's Analysis reads that metadata without the .NET runtime, on any platform, and condenses it into a report that answers the usual triage questions in one screen.
The raw structures are still available under COM descriptor (headers, streams, every metadata table). Analysis is the interpretation on top.
Views
| View | Columns | Use it to |
|---|---|---|
| Summary | identity, runtime, dependencies, exposure, contents, layout clues, structure | The triage report below |
| Imports | Assembly · Version · Culture · Key token · Types · Members | Every referenced assembly, expandable to the types and members actually used (AssemblyRef → TypeRef → MemberRef) |
| Native imports | DLL · Functions | P/Invoke: native functions the assembly declares, grouped by DLL. Each expands to Function · Declared as · Flags |
| Exports | Type · Kind · Methods · Fields | The public API: types visible outside the assembly (nested types count only when every enclosing type is visible), with public and protected members. Also forwarded types and native exports |
| Resources | Name · Visibility · Size · Content · Entropy · Offset | Managed resources with their detected content type and entropy: a large resource near 8.0 is where .NET droppers keep an encrypted payload. Offset is where its bytes start in the file; for an assistant, file.exe#netres:NAME is the resource as a layer to decode, hash or search. A resource set (….resources) is a container: list_container lists its resources with their types, and #netres:SET#entry:NAME opens one (a byte[] or serialized bitmap holding a payload) |
| Methods (GUI) | Type · Method · Token · IL size · RVA | Every method. Select one and its IL appears in the lower pane: offset, opcode and the operand resolved (strings, members with their assembly, fields, branch targets). Built when the row is opened, so large assemblies cost nothing up front |
Read the code, not only the metadata
Open Methods and filter for a suspicious name (Decrypt, KeyLogs, Steal): the IL shows what the method loads and calls. In the Strings view, a .NET string's Referenced by counts the ldstr instructions that load it. For an assistant, the same is list_types, disassemble, get_xrefs and the IL call trees, on mixed-mode (C++/CLI) assemblies as well as IL-only ones.
Table rows link back to their metadata rows (Go to …, or double-click).
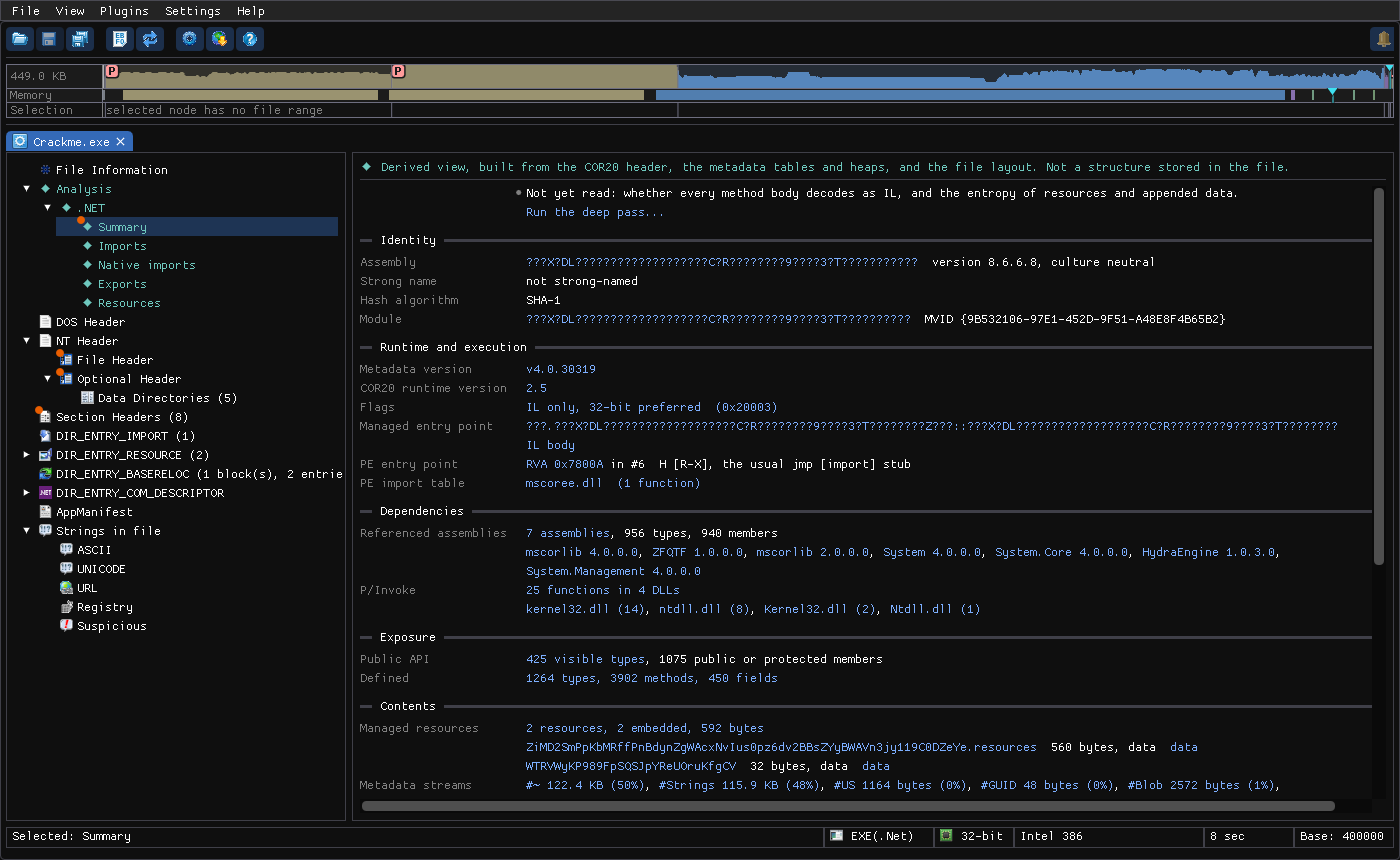
Linux screenshot: .NET Summary of an obfuscated assembly
What the Summary tells you
| Section | Facts |
|---|---|
| Identity | Assembly name, version and culture · strong name (public key, signature) · hash algorithm · module name and MVID · target framework, title, product, copyright, file/informational versions, GUID from custom attributes · reproducible build flag |
| Runtime and execution | Metadata version · COR20 runtime version · flags decoded · managed entry point (or "none, a library") · the PE entry point and whether it's the usual jmp [import] stub · PE import table |
| Dependencies | Referenced assemblies with versions · P/Invoke function count per DLL |
| Exposure | Public API size · defined types, methods and fields |
| Contents | Managed resources (count, embedded, bytes) · metadata stream sizes and shares |
| Layout clues | Metadata size and its section · sections that are writable and executable · overlay |
| Structure | Anomalies: duplicate stream names (with which copy the runtime reads), non-standard stream names, the table stream's extra-data flag, and the module initializer |
Duplicated metadata streams are read the way the runtime reads them (the first copy wins), so PPEE shows what actually executes, not what a naive parser would pick.
Reading a .NET Summary like an analyst
| Observation | What it suggests |
|---|---|
| Assembly and module names that are long strings of mixed scripts or gibberish | Renaming obfuscation. Names carry no information, so use the referenced assemblies, P/Invoke and resources |
| Referenced assembly you don't recognise (a vendor-specific name) | A bundled helper or the obfuscator's own runtime (see the sample below) |
| Managed entry point in a type with a random name | Standard for obfuscated code. The deep pass tells you whether its body is real |
P/Invoke to VirtualAlloc/VirtualProtect/WriteProcessMemory/NtUnmapViewOfSection/ZeroMemory | Managed code driving native injection or self-modification |
| P/Invoke declared under obfuscated names (the Declared as column) | Renamed wrappers. The Function column still shows the real API |
| Only a few small resources, one with entropy > 7.5 | An encrypted payload or configuration, decrypted at run time |
| Sections writable and executable, or packed-looking (high entropy) | A native stub or a packer wrapping the assembly |
| Duplicate or fake metadata streams | Anti-analysis: some tools read a different copy than the runtime |
| 32-bit preferred / 32-bit required flags | Constrains the process bitness |
| Reproducible build | Deterministic build: timestamps are content hashes, not dates |
The deep pass on an obfuscated sample
Walkthrough: an obfuscated .NET crackme
Without the deep pass, the Summary lists the identity, 7 referenced assemblies (including the unfamiliar HydraEngine and ZFQTF), 25 P/Invoke functions in 4 DLLs (kernel32, ntdll), 1,264 defined types, and two managed resources. The assembly and module names are long strings of mixed scripts.
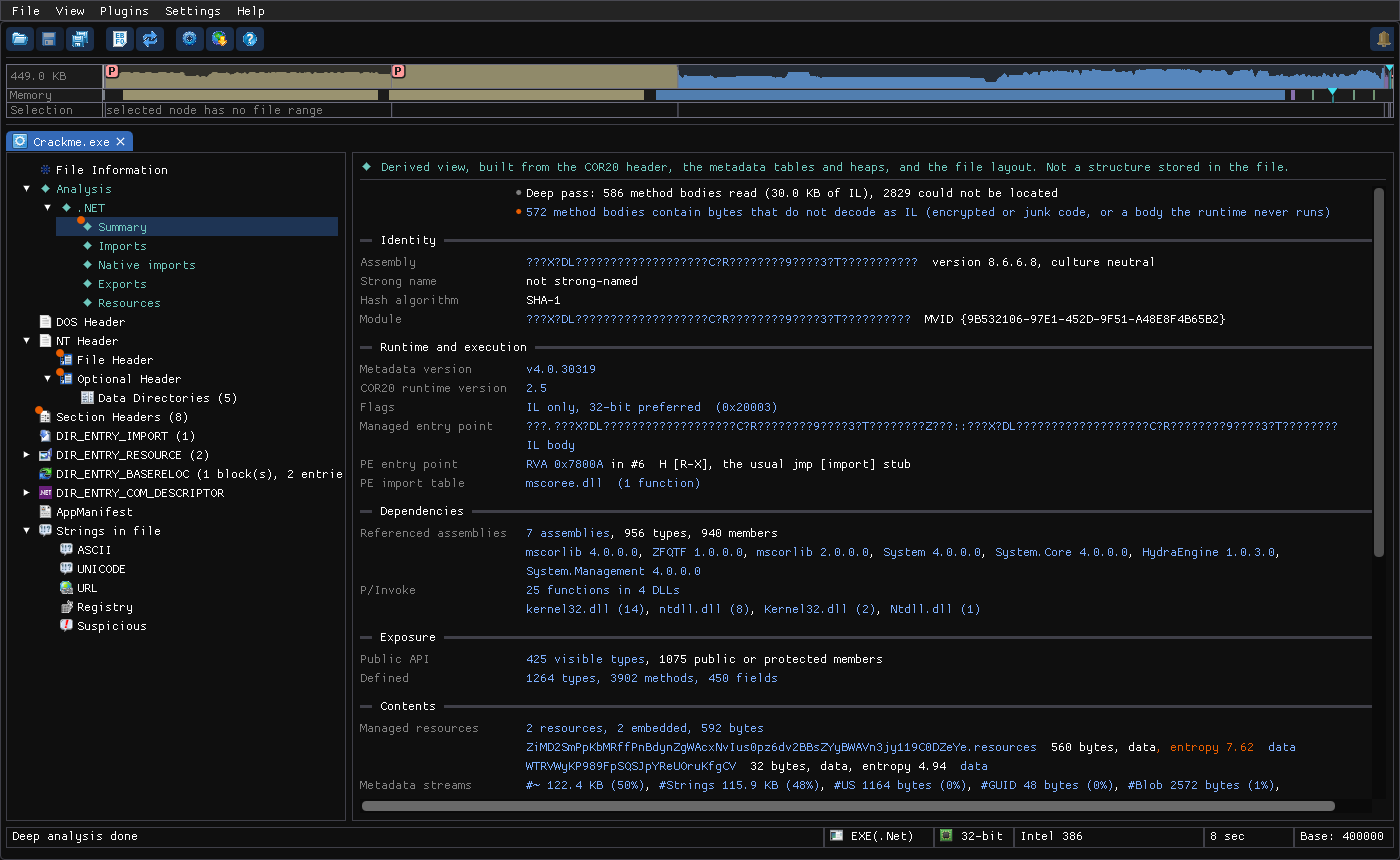
Run the deep pass and the picture changes:
Deep pass: 586 method bodies read (30.0 KB of IL), 2829 could not be located
[*] 572 method bodies contain bytes that do not decode as IL
ZiMD2SmPpKb….resources   560 bytes, data, entropy 7.62   data
[*] #1  &f.ygm.E: writable and executable
[*] #2  &f.ygm.E: writable and executable; executable, entropy 8.00
Duplicate stream name #GUID: the runtime reads the first one
Non-standard stream name "#_96343_77181_36468_78224"
572 of 586 readable method bodies are not valid IL: the real code is encrypted and restored at run time. The managed resource has entropy 7.62 (an encrypted payload). Three sections are writable and executable, one with entropy 8.00. Together: a packed and encrypted .NET sample, and PPEE told you so without executing anything.
CLI and JSON
PS C:\> ppee-cli.exe --analysis-deep C:\MalwareSamples\crackme.exe
C:\MalwareSamples\crackme.exe: 66048 bytes, PE32

Analysis (derived views, not PE structures):

Code
  Detected: x86 machine code

Code > Summary  (built from entry point, TLS callbacks, all decoded code)
Entry point
  Address: 0x401000 [code 0x401000: entry point]  in .text
        00401000  push 0x0
        00401002  call 0x40134E
        00401007  mov dword ptr [0x406206], eax
        0040100C  push esi
        0040100D  push 0xA
        0040100F  push 0x1F7
        00401014  push dword ptr [0x406206]
        0040101A  call 0x401348
        0040101F  push eax
        00401020  push eax
        00401021  push dword ptr [0x406206]
        00401027  call 0x40136C

What the code does
  - Nothing notable in the decoded code.

Imports in use
  Other processes: ResumeThread (2), SuspendThread (2)
  Run-time linking: GetModuleHandleA (2)

Coverage
  Decoded: 1905 instructions, 49 functions
  - Found by following direct calls and jumps from the entry point, TLS callbacks, exports, .pdata, the CFG function table and relocated pointers; code reached only through computed jumps is not covered, so every count is a lower bound.

Code > API call sites (32)  (built from decoded code, import table)
API                           Topic             Call sites
kernel32.ResumeThread         Other processes   2  [code 0x4013A6: kernel32.ResumeThread call]
    Function         Address   Instruction
    sub_401384+0x22  0x4013A6  call 0x4040DC  [code 0x4013A6: 0x4013A6]
    sub_4040DC       0x4040DC  jmp dword ptr [kernel32.ResumeThread]  [code 0x4040DC: 0x4040DC]
kernel32.GetModuleHandleA     Run-time linking  2  [code 0x401002: kernel32.GetModuleHandleA call]
    Function        Address   Instruction
    EntryPoint+0x2  0x401002  call 0x40134E  [code 0x401002: 0x401002]
    sub_40134E      0x40134E  jmp dword ptr [kernel32.GetModuleHandleA]  [code 0x40134E: 0x40134E]
kernel32.SuspendThread        Other processes   2  [code 0x4013AD: kernel32.SuspendThread call]
  ...
# Triage summary: P/Invoke DLLs, referenced assemblies, resources
ppee-cli --json --analysis f.exe | jq '.analysis.runtimes[] | select(.key == "net") | {
  referenced: [.views[] | select(.key == "analysis.net.imports") | .table.rows[].cells[0]],
  pinvoke:    [.views[] | select(.key == "analysis.net.nativeimports") | .table.rows[] | {(.cells[0]): .cells[1]}] | add,
  resources:  [.views[] | select(.key == "analysis.net.resources") | .table.rows[] | .cells[0:3]]}'

# Which native APIs does the managed code call?
ppee-cli --json --analysis f.exe | jq -r '.analysis.runtimes[] | select(.key == "net") | .views[] | select(.key == "analysis.net.nativeimports")
  | .table.rows[] | .cells[0] as $dll | .detail.rows[] | "\($dll)!\(.cells[0])"'

# Encrypted method bodies? (deep pass) -- count of undecodable bodies
ppee-cli --analysis-deep f.exe | grep -oE '[0-9]+ method bodies contain bytes that do not decode'

# Structure warnings: duplicate or fake metadata streams
ppee-cli --json --analysis f.exe | jq -r '.analysis.runtimes[] | select(.key == "net") | .views[0].blocks[] | select(.kind == "note") | [.spans[].text] | join("")' | grep -iE 'stream|extra-data'
Manual check first, analyzer second
The COM descriptor page explains the raw header and streams. Use Analysis for the quick answer, then open the raw DIR_ENTRY_COM_DESCRIPTOR tree to inspect individual tables.
Related: Analysis overview · --analysis · COM descriptor directory · Resources
References
- ECMA-335: Common Language Infrastructure: the standard that defines .NET metadata tables, heaps and IL.